APEX EcoBuilt
Leading Manufacturer of Aluminum Systems & Modular Housing
APEX EcoBuilt
Leading Manufacturer of Aluminum Systems & Modular Housing

 08 Jun, 2026Knowledges
R-value tells you how well a material resists heat flow, U-value tells you how much heat passes through a whole assembly, and SRI tells you how a surface handles sunlight. They sound similar but they aren’t interchangeable — and misreading them is one of the most common reasons buildings underperform their design targets. This guide breaks down what each metric actually measures, where spec sheets mislead buyers, and how to use these numbers to make smarter envelope decisions.
R-value is the most marketed and most misunderstood number in the building industry. It measures a material’s resistance to conductive heat flow — higher R means the material slows heat down more effectively. Simple enough.
Here’s the catch: R-value is a material property measured in a lab, usually at 24°C with no wind, no moisture, and no thermal bridging. The real wall doesn’t live in a lab. A fiberglass batt rated R-19 can deliver as little as R-11 in practice once you account for studs, air gaps, and compression around wiring.
If you’re sourcing globally, watch the units. An R-20 in the US (ft²·°F·h/Btu) converts to roughly RSI-3.5 in metric (m²·K/W). A European spec sheet showing R=3.5 is not worse than an American R=20 — they’re the same thing. We’ve seen procurement teams reject perfectly adequate insulation because nobody caught the unit swap.
R-value is useful when you’re comparing two insulation products of the same thickness, in the same application. It becomes misleading the moment you compare a continuous insulation layer to a cavity-fill product, because the cavity product loses huge amounts of performance to thermal bridging through framing.
If R-value is the ingredient, U-value is the finished dish. U-value measures how much heat passes through an entire assembly per square meter per degree of temperature difference — walls, windows, roofs, curtain walls — accounting for every layer, every frame, every fastener.
U-value is the inverse of R-value (U = 1/R), but only for a complete assembly. A window with U-value 1.4 W/m²·K loses twice as much heat as one at 0.7 W/m²·K, all else equal. This is the number that most energy codes — ASHRAE 90.1, EN standards, China’s GB 50189, the UAE’s Estidama — actually regulate.
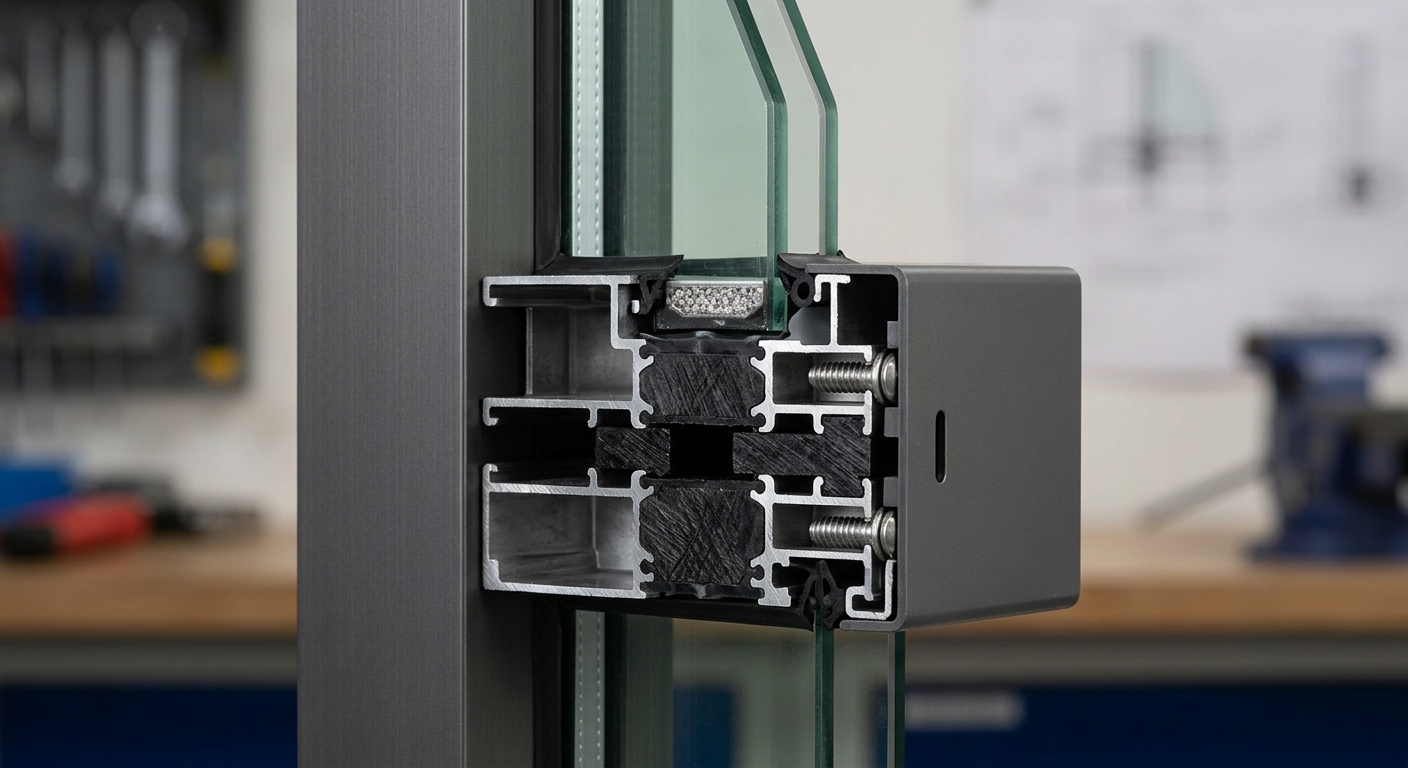
This is where curtain wall specs get sneaky. A supplier might advertise “U-value 1.1” based on center-of-glass performance only. The whole-window U-value, including the aluminum frame and spacer, can easily be 1.8 or worse if the thermal break is undersized. Always ask for Uw (whole-window) or Ucw (whole curtain wall) — not Ug (glass only).
For a deeper dive into this in hot climates, our guide on specifying curtain walls for Middle East climates walks through the thermal break math in detail.
A hotel developer in Riyadh once pushed back on our glazing spec because a competitor quoted Ug=1.0 vs. our Ug=1.1. We ran the whole-wall calculation: their system, with a 14mm polyamide thermal break, delivered Ucw=2.3. Our system, with a 34mm break, delivered Ucw=1.6. Over a 40,000 m² façade, that difference was around 1.8 GWh of cooling load per year. They switched.
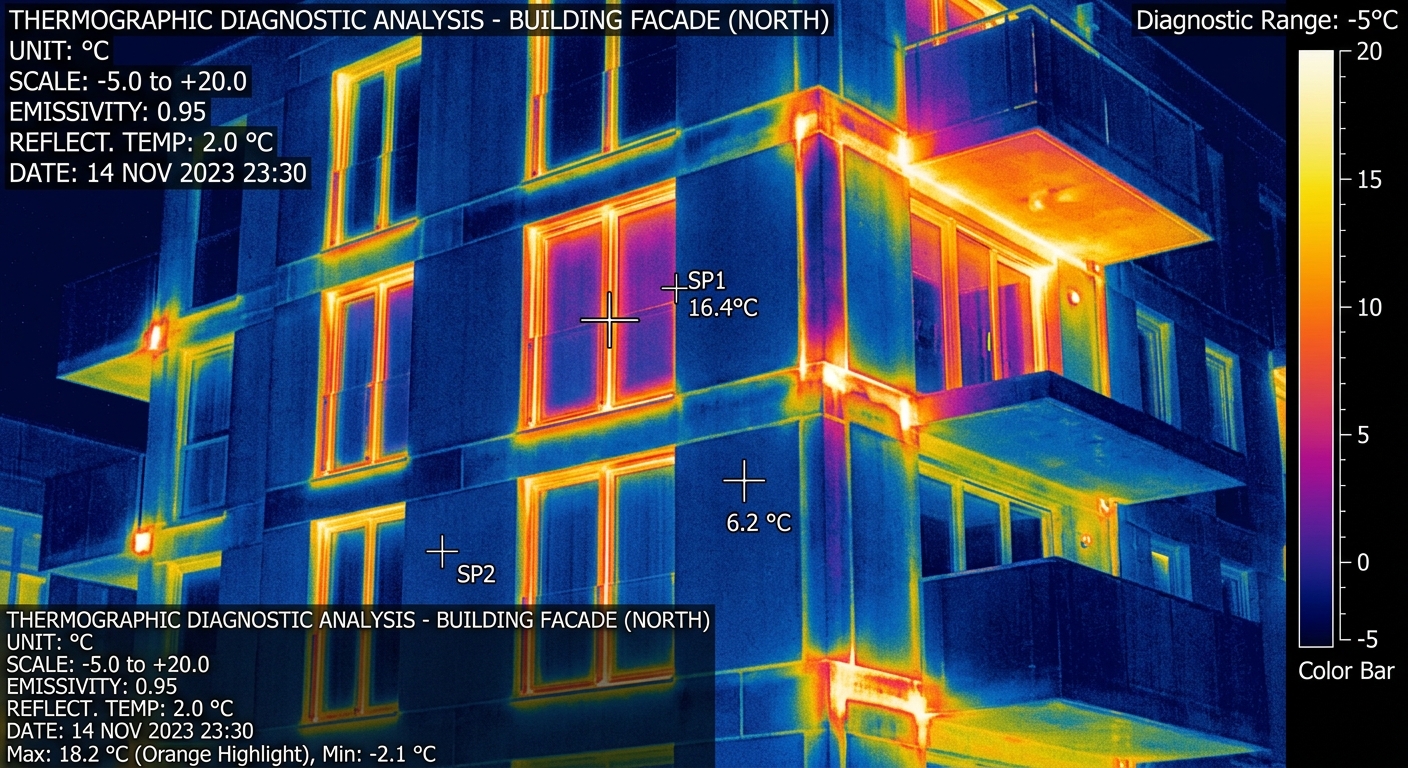
Solar Reflectance Index (SRI) is the forgotten metric — until you step onto a dark roof in July and feel the heat radiating through your shoes. SRI combines two properties: solar reflectance (how much sunlight the surface bounces back) and thermal emittance (how readily it releases absorbed heat).
SRI is scaled so a standard black surface = 0 and a standard white surface = 100. Cool roof products routinely hit SRI 80–110. A standard dark metal roof might sit at SRI 25–35, which translates to surface temperatures 30–40°C higher on a sunny day.
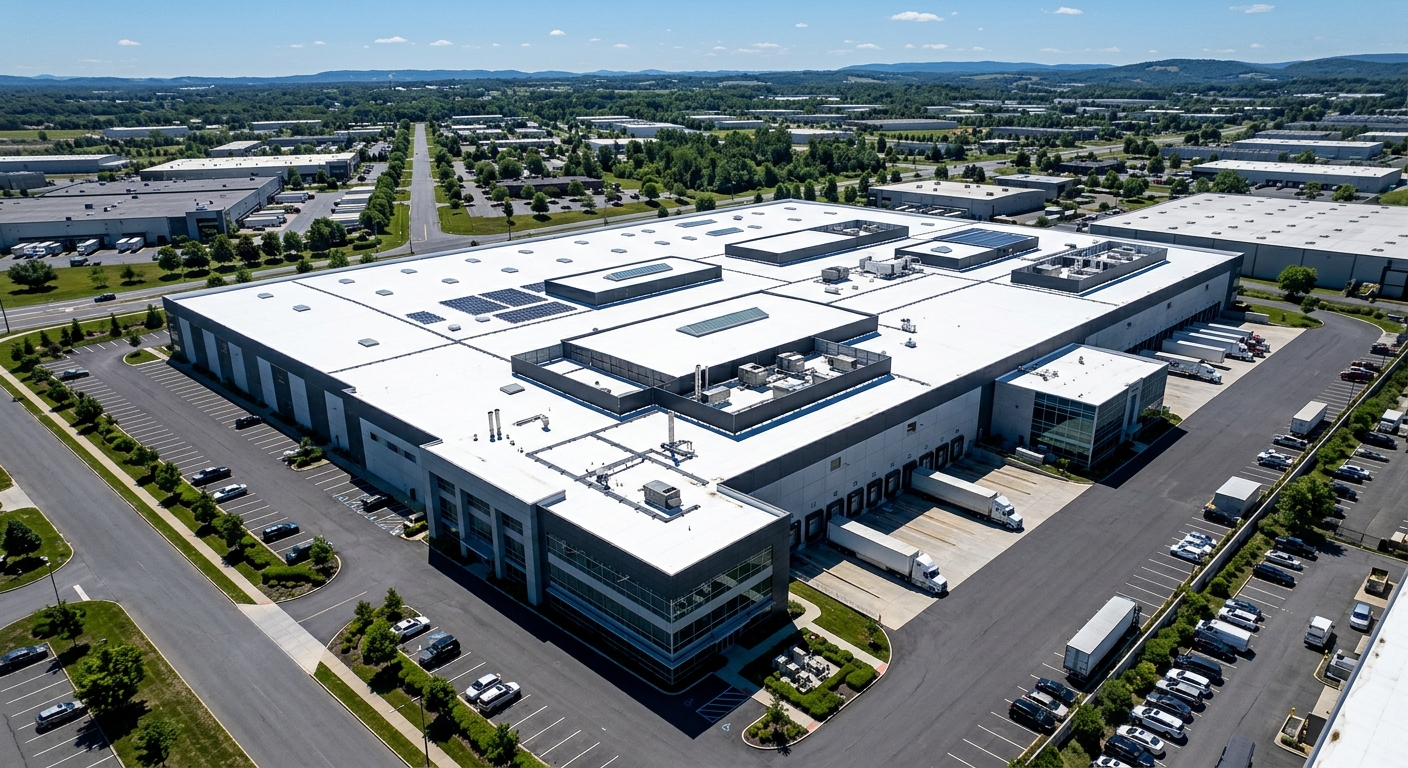
LEED, BREEAM, Estidama, and India’s GRIHA all award credits for high-SRI roofing and paving. In hot regions, the cooling-load reduction from a high-SRI roof can be 10–20% of total building cooling energy. That’s not marginal.
For a logistics operator we worked with in the UAE, switching from a standard grey PPGI roof (SRI ~30) to a high-reflectance cool-coated aluminum roof (SRI 82) dropped peak attic temperatures by 22°C and cut rooftop HVAC runtime by roughly 18% in summer months.
Lab numbers and building performance diverge for predictable reasons. If you only trust the spec sheet, you’ll overspend on premium insulation and still miss your energy target.
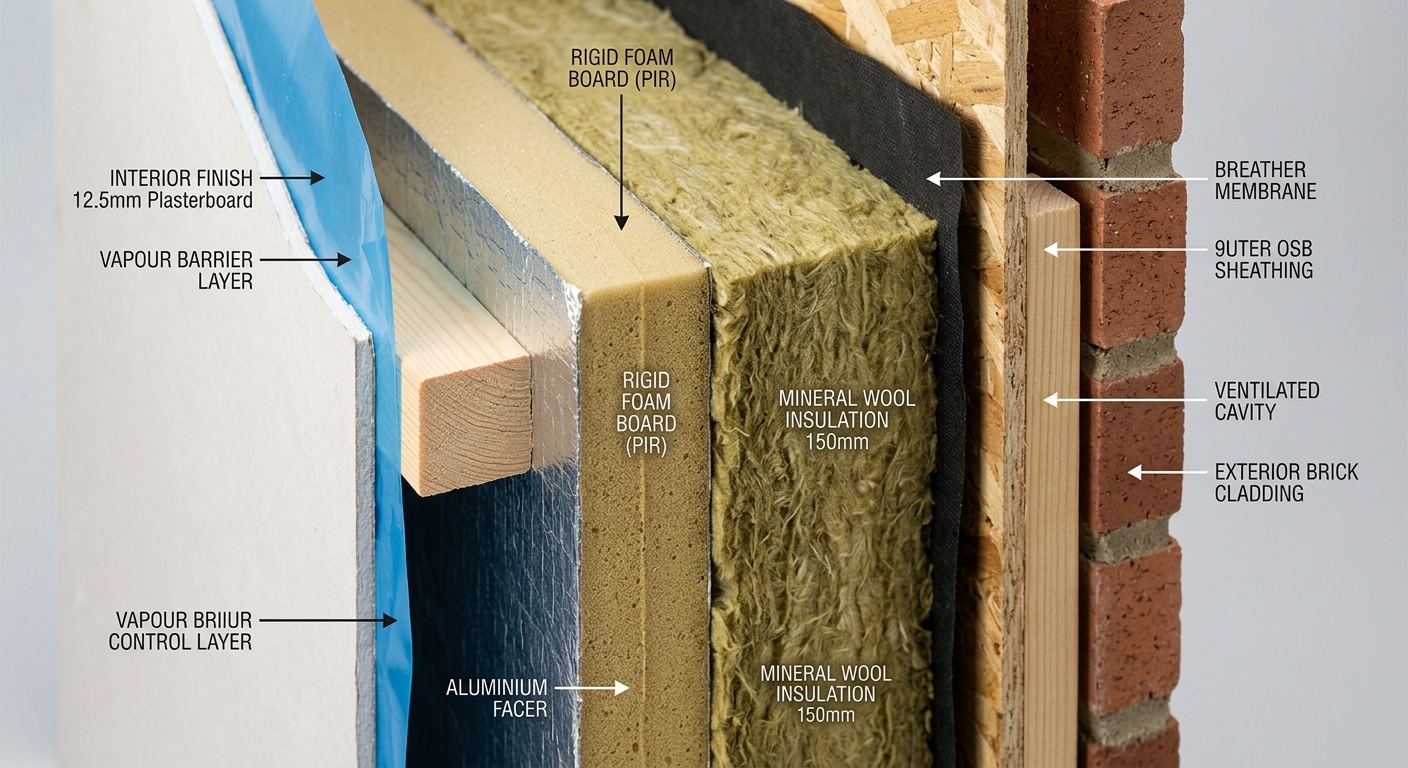
A steel stud conducts heat roughly 400 times faster than the fiberglass between it. In a typical steel-framed wall, framing takes up 15–25% of the wall area but can carry 50%+ of the heat loss. Continuous exterior insulation — even just 25mm of rigid foam — often does more than doubling cavity insulation. We cover this in detail in the discussion on envelope solutions.
A wall with R-30 insulation and 2 mm of gaps around penetrations can lose more heat through air movement than through conduction. R-value assumes zero air flow. Real buildings have plenty. This is why blower-door testing matters more than insulation thickness in high-performance envelopes.
Wet fiberglass loses roughly 50% of its R-value per 1% moisture content by volume. A vapor-open wall in a humid climate without a proper drying path will deliver a fraction of its design R-value within two years.
Stop treating these as interchangeable. Each metric answers a different question.
On most of our large-scale projects, we work through envelope specs in this order: target whole-assembly U-value first (drives code compliance and HVAC), then specify SRI for roof and paving (drives peak cooling), then select individual insulation products by R-value and moisture tolerance. Reversing this order is how buildings end up with fat insulation budgets and mediocre performance.
A single global insulation strategy is a mistake. The metric that matters most shifts with climate.
SRI and solar heat gain coefficient (SHGC) dominate. A reflective roof and low-SHGC glazing outperform thick insulation here. Target roof SRI ≥78, Ucw ≤2.0, SHGC ≤0.25.
SRI still matters, but vapor control becomes equal priority. Insulation placement (outside the vapor barrier) matters more than thickness. Target Ucw ≤2.2 with aggressive moisture management.
U-value rules. Every 0.1 W/m²·K improvement in wall U-value meaningfully cuts heating energy. Target Uwall ≤0.2, Uwindow ≤1.1, continuous insulation mandatory to suppress thermal bridging.
Balance all three. This is where integrated envelope design pays off most — and where we’ve seen the biggest performance gaps between nominally similar buildings. Our modular vs. traditional construction comparison touches on how factory-controlled envelopes reduce this variability.
Five questions to ask any supplier before you trust their numbers:
A reputable manufacturer will hand these over without fuss. If the answer is “trust us,” walk away.
R-value, U-value and SRI aren’t competing metrics — they’re different tools for different jobs. R-value compares materials. U-value compares assemblies. SRI handles the sun. Use all three, in the right order, and you’ll spec an envelope that actually hits its design targets instead of just looking good on paper.
The suppliers who treat these numbers as marketing are the ones whose buildings underperform. The ones who document, test, and stand behind them — with aged SRI data, whole-assembly U-values, and third-party reports — are the ones worth working with long-term.
If you’re planning a façade, roof, or modular envelope and want the numbers to match reality, talk to our engineering team. We’ll run the whole-assembly calculations, flag the trade-offs, and show you how to hit your targets without overspecifying. You can also browse our aluminum systems catalog for tested performance data on every profile.


Arabic

English

Spanish
Fill out the form below and our team will get back to you within 24 hours with a tailored solution.
